
Scientific Figure Colors: Three-Color Roles and Legends
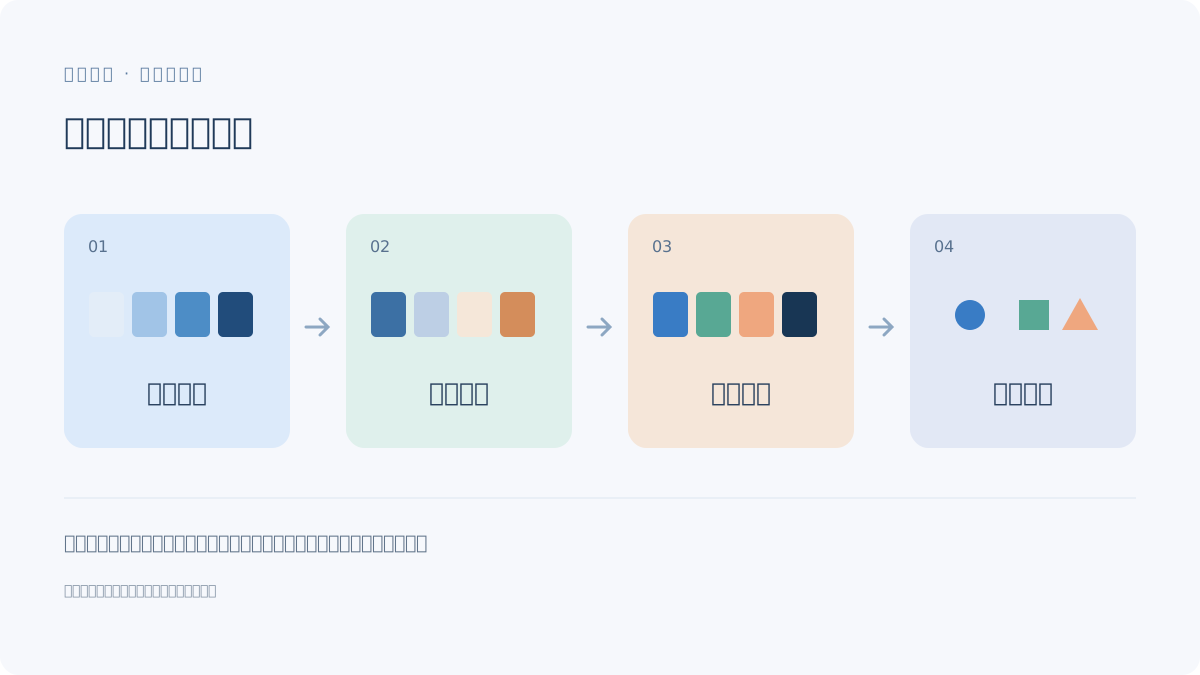
Assign colors to defined roles rather than decoration. Combine color with labels or boundaries, keep the legend consistent and check both grayscale and final-size exports.
Define what each color means
State whether a color identifies a material, group, state or pathway. Do not use the same unexplained color for unrelated roles across panels. A continuous gradient should have a defined quantitative scale when it encodes values; an illustrative glow is not measured data.
Try three different three-color tasks
| Task | Example color roles | Additional cue |
|---|---|---|
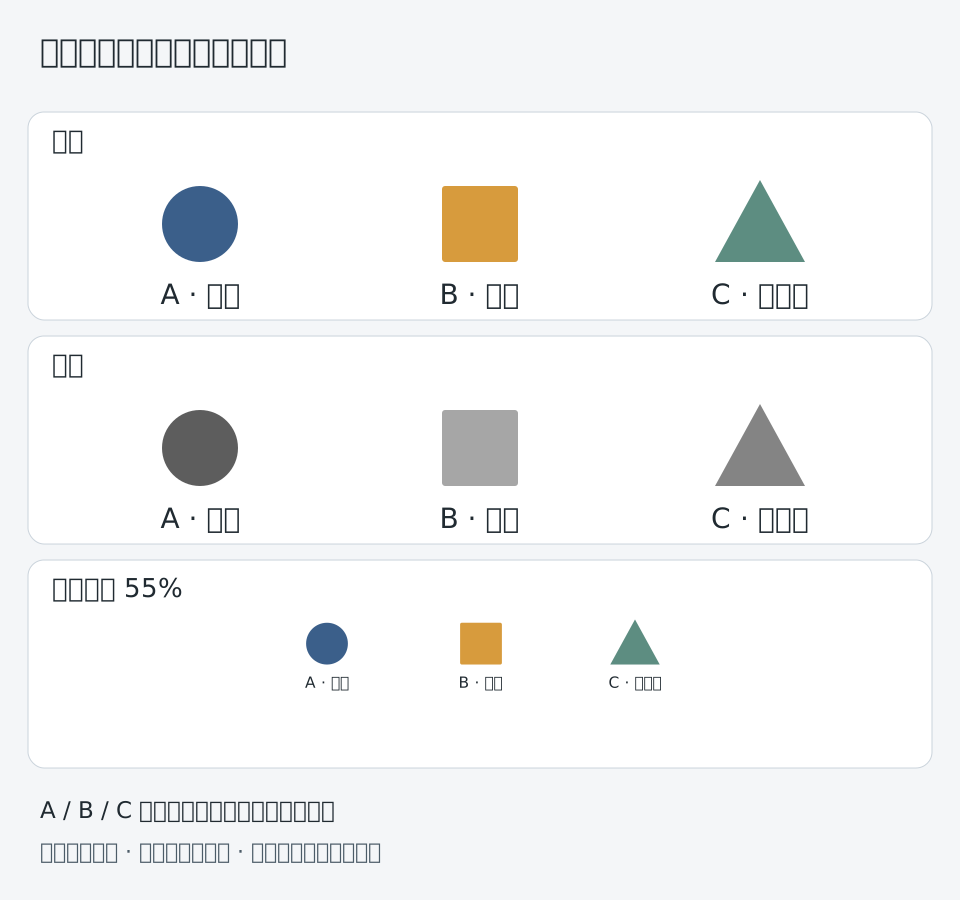
| Three categories | Blue, orange and purple category labels | Names and boundaries |
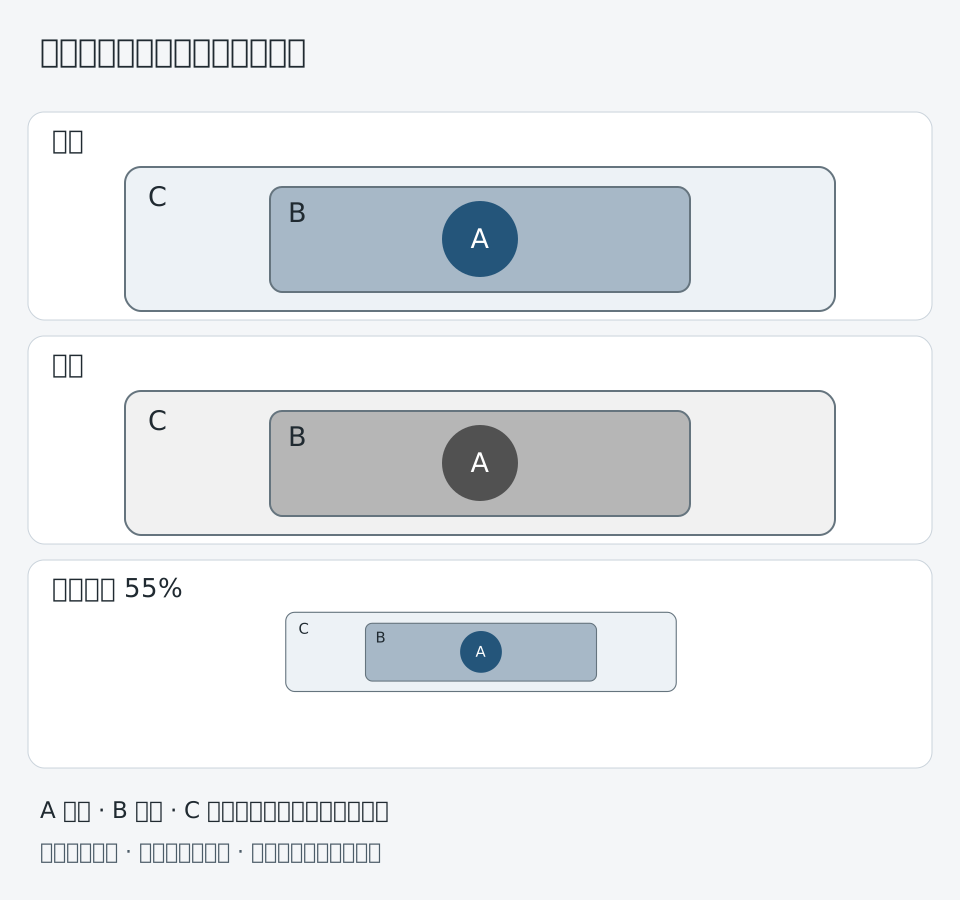
| Subject and context | Main-object blue, contextual gray, selected-site orange | Position and outlines |
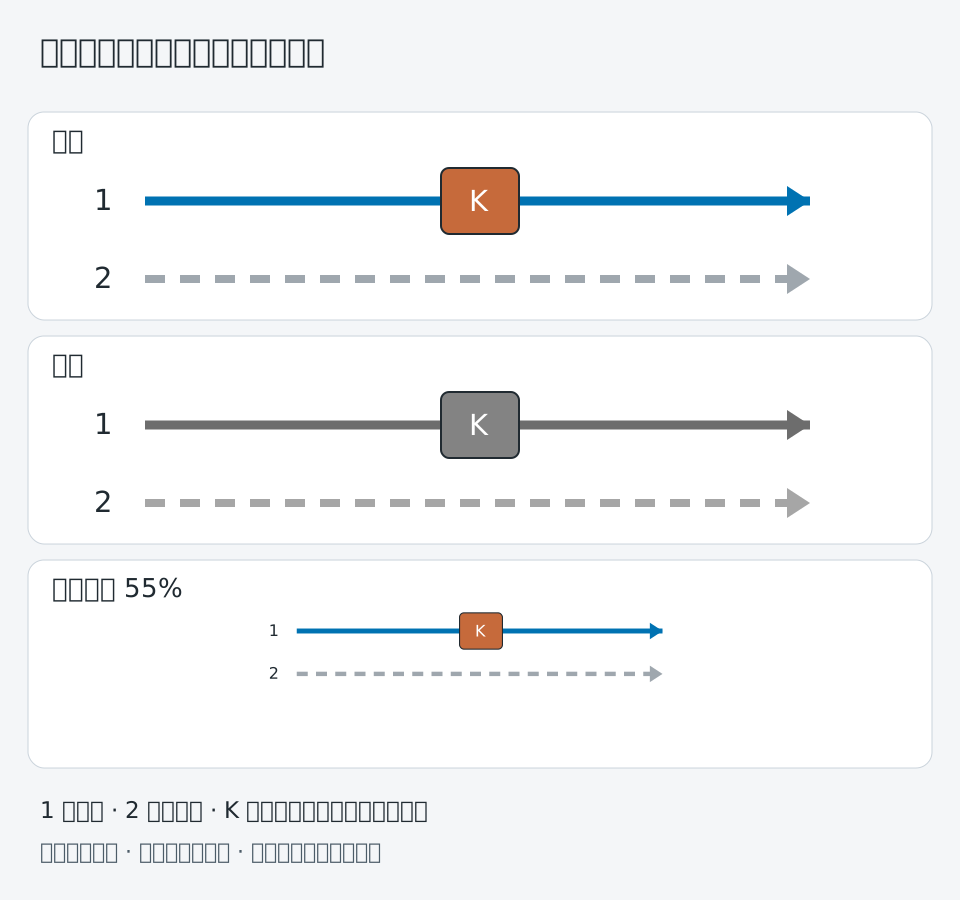
| Emphasized pathway | Neutral background, blue objects, orange selected route | Arrow style and caption |
These examples define roles, not a universal journal-approved palette. Check the actual artwork against the relevant accessibility and publication requirements.
Read the catalytic-interface example
The catalytic archive distinguishes a blue substrate, selected green sites and ball-and-stick molecules. A lower key connects color to object identity. The methane-hydrate figure keeps a common key across compared systems.
Check grayscale and reduction
Inspect a grayscale version for categories that collapse into similar tones. Add labels, line styles or boundaries where color alone carries the meaning. Then reduce to the intended publication size and review small symbols and legend text. Keep image adjustments consistent and documented when processing research images.
Keep cover expression separate from data coding
The Natural Product Reports artwork uses matched arrow and molecular colors as a cover metaphor. It is not a quantitative palette specification. For data plotting use the data-visualization scope; for composition use panel layout.

Sources and scope
Sources apply within their stated scope. Archive records describe existing work; international account access and checkout remain closed.
Choose the next step
Understand the platform · Scope a design commission · Contact support