
Research Data Visualization and Figure Preparation
Start from traceable data and a stated comparison. Confirm whether the job includes plotting, figure styling or analysis, and keep those responsibilities explicit.
Separate plotting from illustration
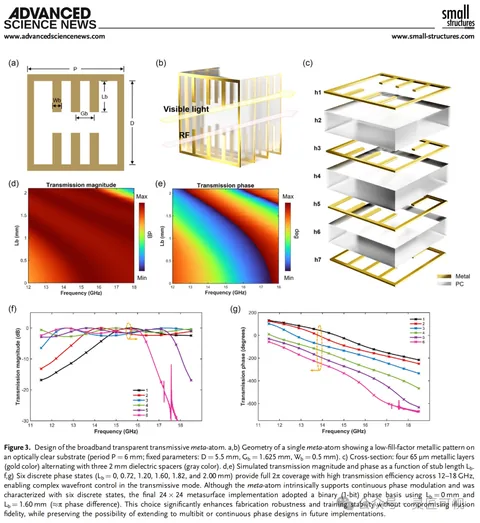
A chart encodes values; a mechanism drawing explains objects and relationships. Replacing a plotted result with a decorative schematic changes the evidence shown. The metasurface project distinguishes overview diagrams, structural views, curves and an experimental setup across its archived images.
Prepare data with units and definitions
Provide an approved table, variable names, units, sample definitions and the comparison to be displayed. Identify replicates, error-bar definitions, normalization and missing values. If these are unresolved, agree the analysis method before visual styling. Do not send participant identifiers or unpublished datasets in an initial public inquiry.
Define the actual delivery
Agree the number of charts, chart types, axis ranges, legends, panel assembly, source files and output dimensions. If code, a plotting workbook or statistical analysis is required, include it explicitly in the quote. A raster image alone is not an editable plotting source.
Review consistency and provenance
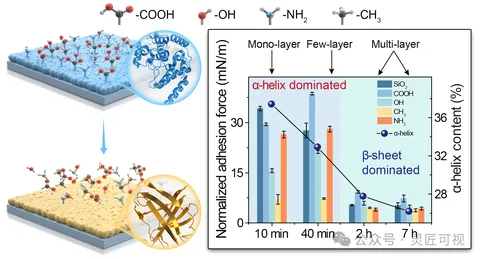
The protein-adhesion case places structure diagrams and plotted results in separate visual roles. Check that colors and labels connect corresponding objects without implying a quantitative result from an illustrative shape. See color roles, panel layout and price-scope factors.
Choose the next step
Understand the platform · Scope a design commission · Contact support