
How to Make a Scientific Paper Figure
Define the figure’s role, research objects and supported relationships first. Arrange panels and labels around that task, then inspect the final file against the target journal’s instructions.
Distinguish four figure tasks
A main-text schematic explains a research object, process or spatial relationship. A data plot encodes observations. A TOC graphic introduces the paper at directory size; a cover proposes a visual theme for an issue. Write down the intended use, target journal, submission stage and output format before selecting a tool or style.
Turn the research into a reading path
List the objects, the location or scale of each one, and the meaning of each arrow. State which relationships are established, proposed or contextual. Build a rough content skeleton with placeholder shapes. The mechanism tutorial addresses arrow meaning in more detail; the panel-layout guide addresses reading order and spacing.
Compare three archived compositions
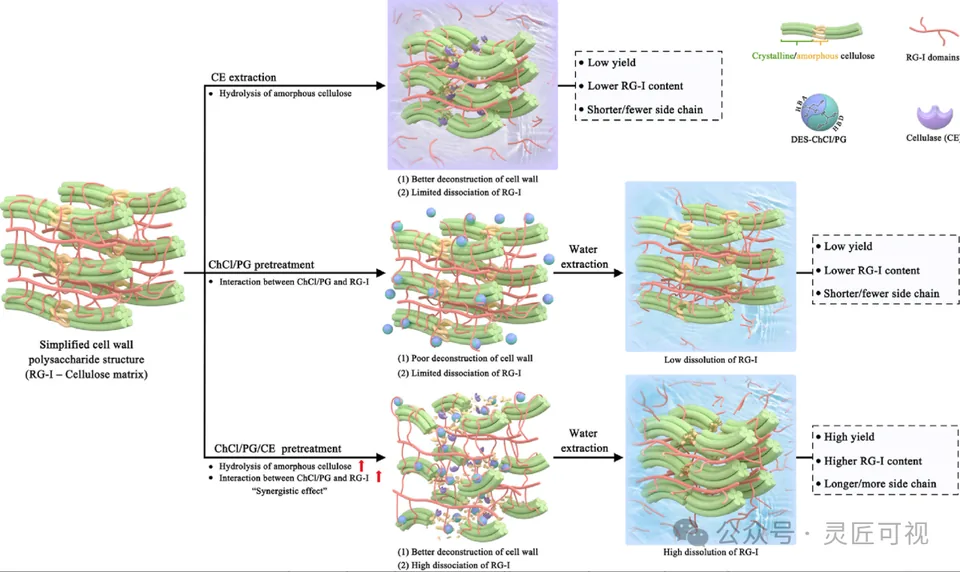
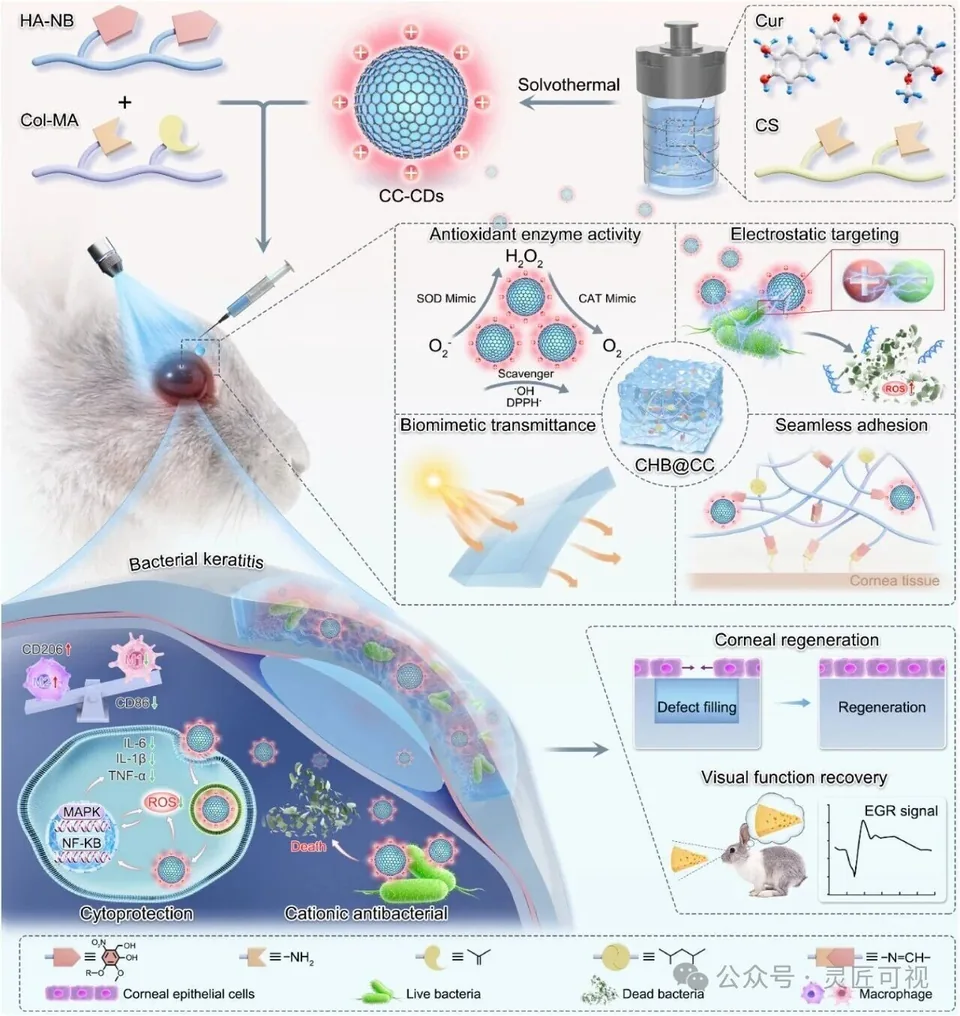
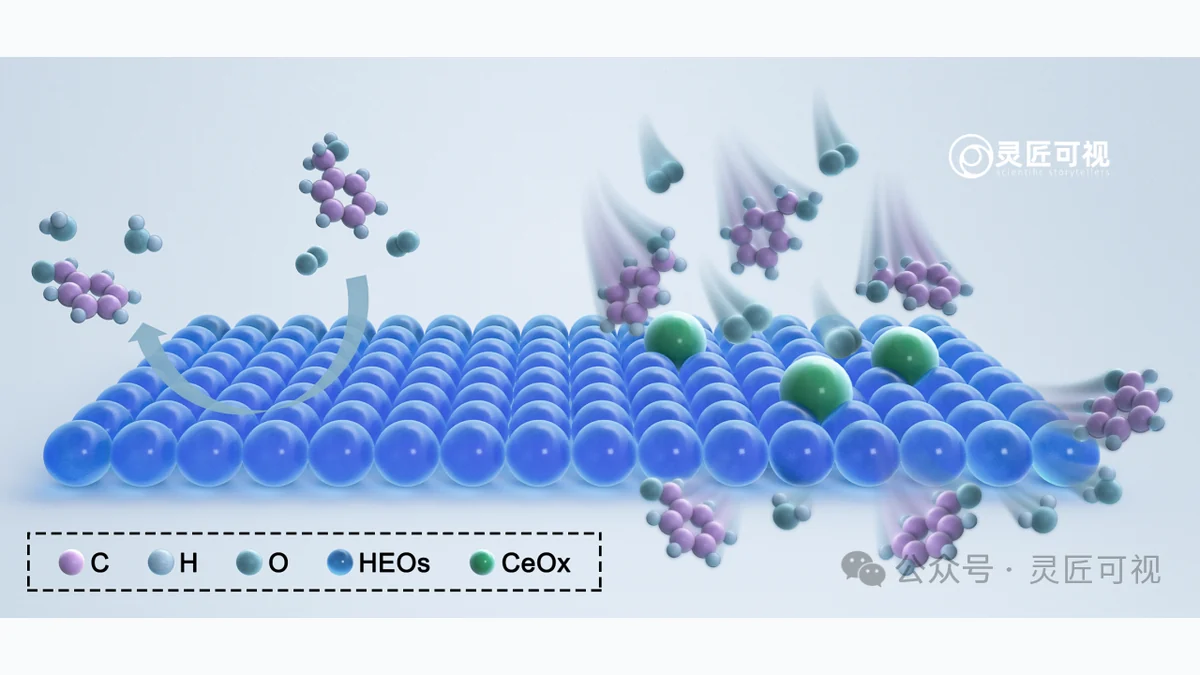
The apple-pectin figure uses a shared starting structure and three aligned routes. The ACS Nano hydrogel figure links an overall application to several local views. The catalytic-interface figure uses a continuous substrate, selected sites and a shared legend. They provide different answers to comparison, scale and mechanism tasks; their layouts do not establish additional experimental findings.
Check the final publication size
Read the current instructions for the actual journal and figure category. Review dimensions, effective resolution, fonts, file type, color and any source-file requirements. The term “SCI” does not define one universal size or dpi. Inspect a reduced export rather than relying on a magnified editing view.
Complete the submission check
- Confirm labels, units, scale bars and panel references against the manuscript.
- Make object and arrow meanings consistent across panels.
- Retain original image data and document image adjustments.
- Confirm permissions for all incorporated material.
- Open the actual exported file and compare it with the approved source.
Use the submission checklist and journal resource hub. For self-directed editing see the platform scope; for collaboration see paper-figure design.

Sources and scope
- Nature figure specifications
- Nature figure-panel construction and export
- Nature image-integrity guidance
Sources apply within their stated scope. Archive records describe existing work; international account access and checkout remain closed.
Choose the next step
Understand the platform · Scope a design commission · Contact support